Graphs
|
|
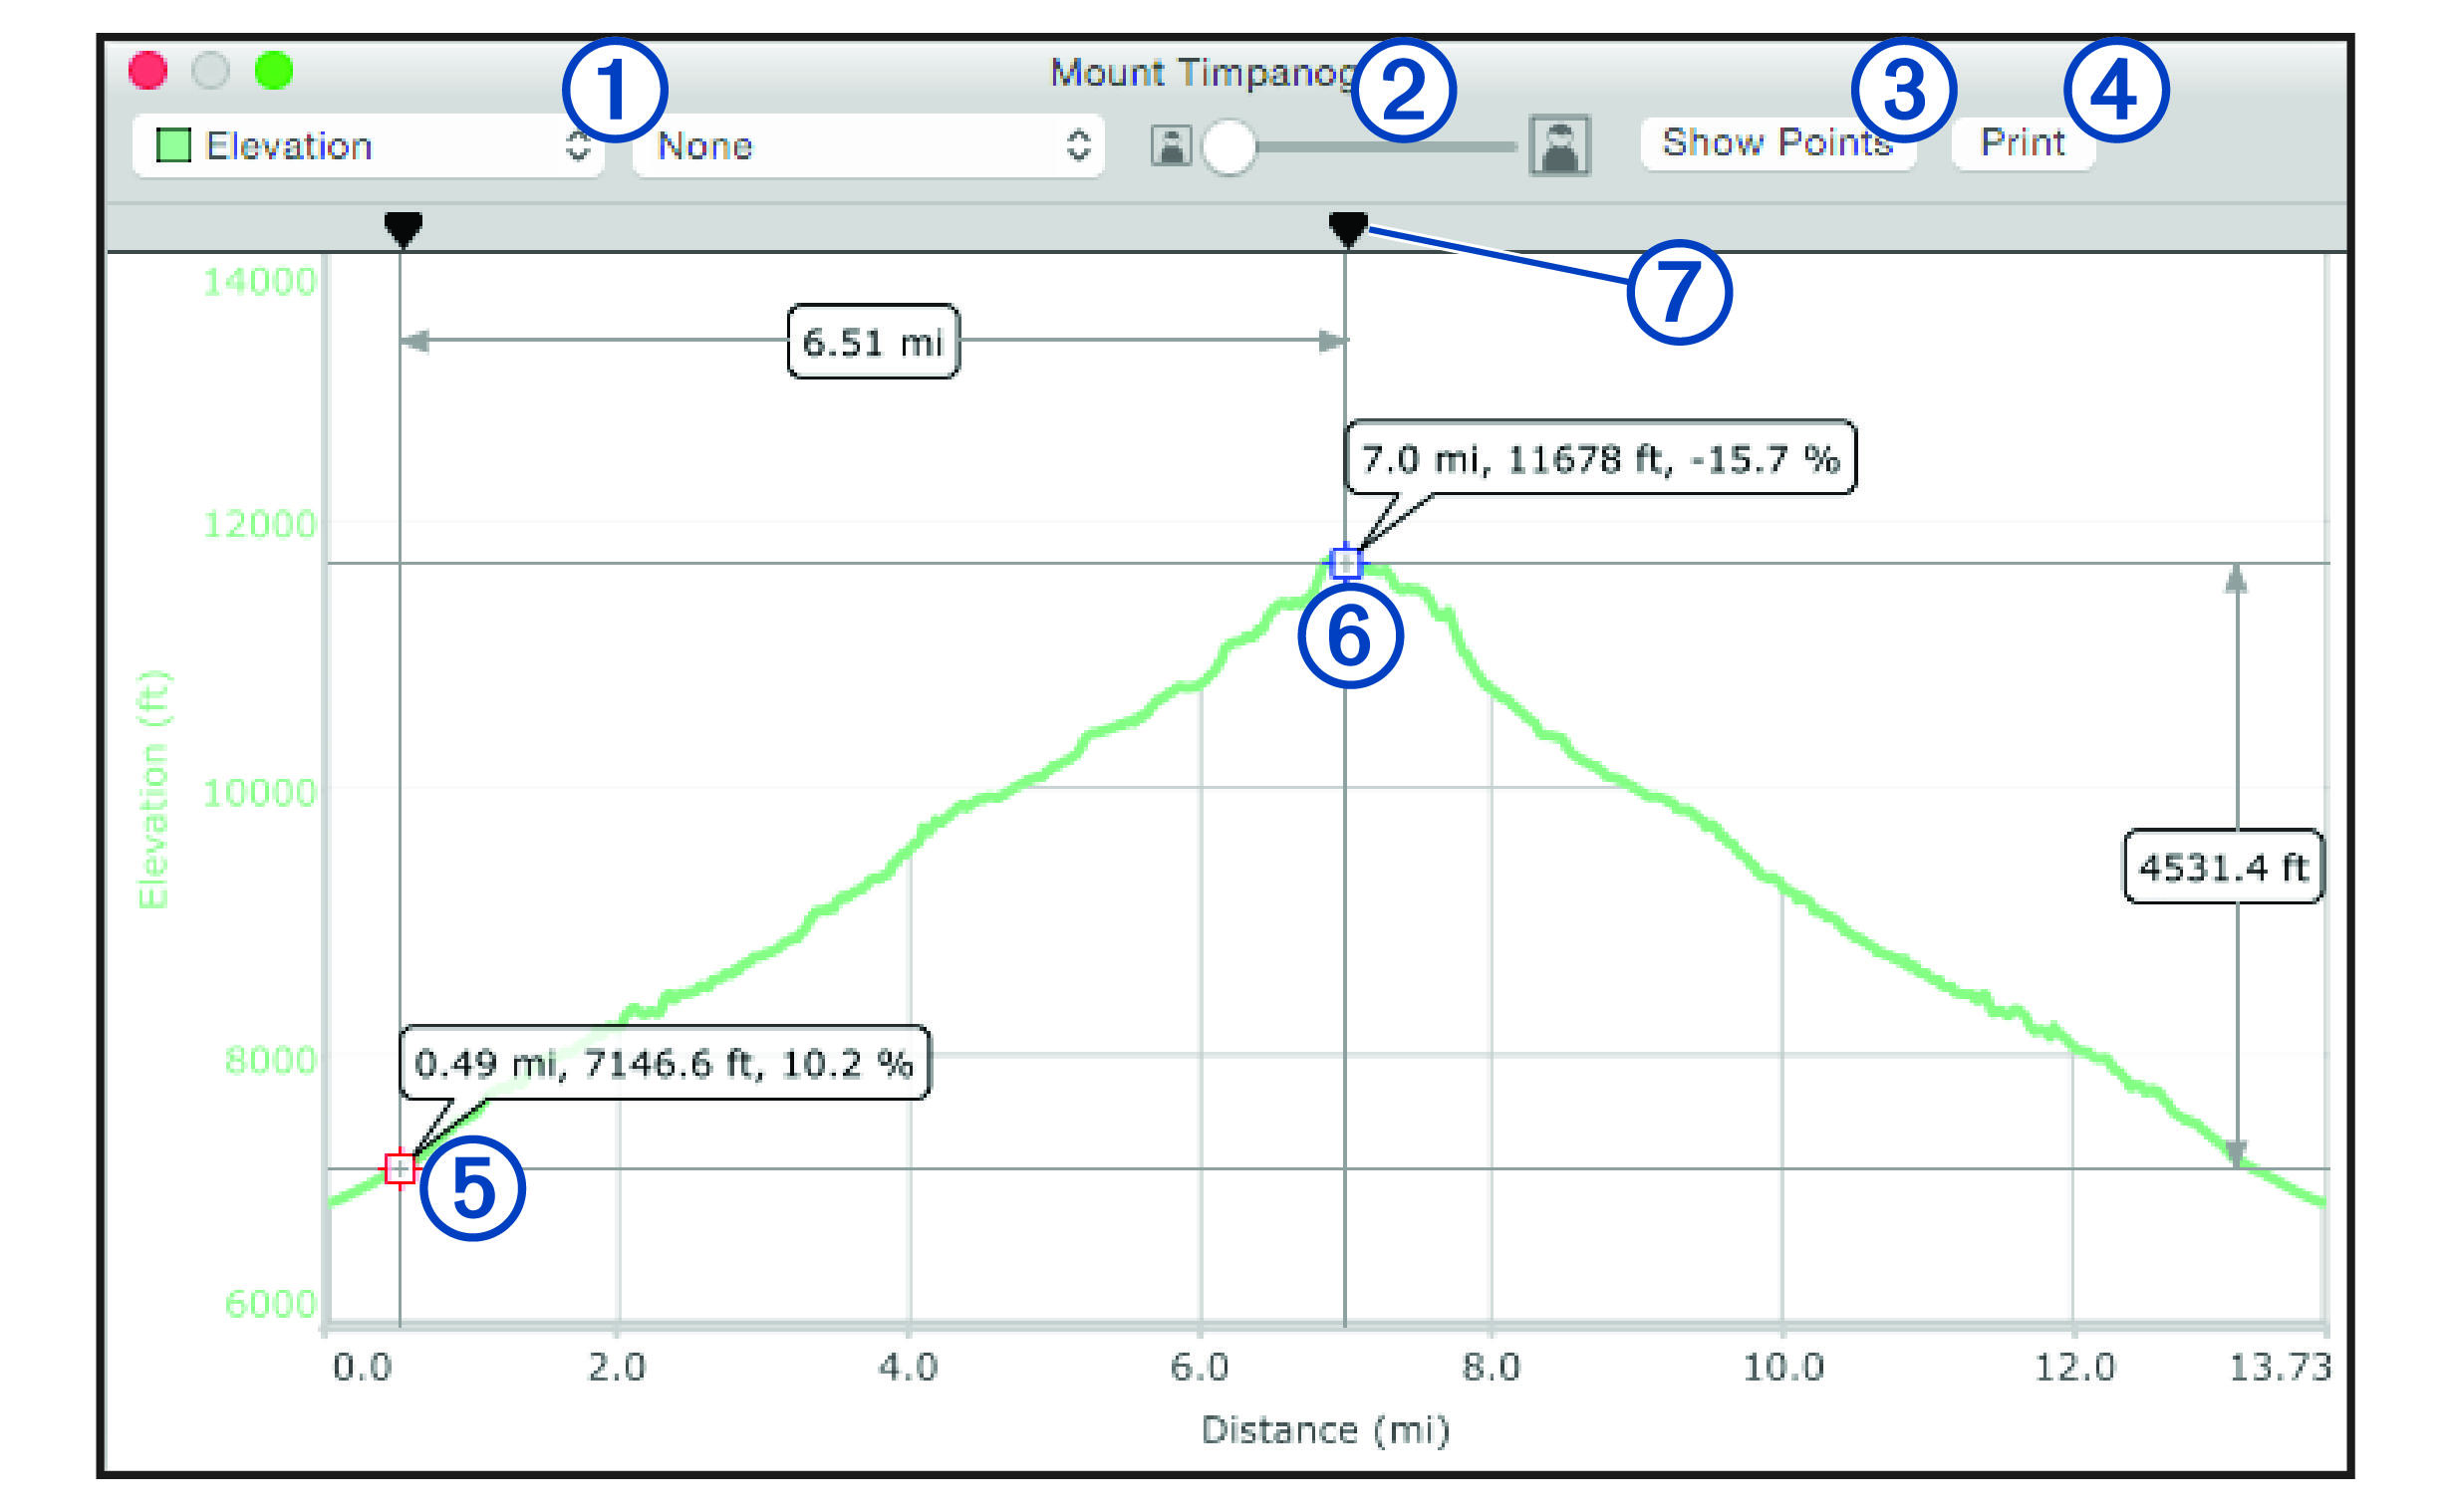
Selects the type of data shown on the graph. |
|---|---|
|
|
Zooms in and out on the graph. |
|
|
Shows or hides points on the graph. |
|
|
Prints the graph. |
|
|
Indicates the first location selected for comparison. Location information appears when you select the location marker on the graph, and an orange highlight appears at that location on the map. |
|
|
Indicates the second location selected for comparison. Comparison information appears when you select the second location marker on the graph, and an orange highlight appears between the two locations on the map. |
|
|
Moves the selected points. |


