Viewing Your Predicted Race Times
For the most accurate estimate, complete the user profile setup (), and set your maximum heart rate ().
Your watch uses the VO2 max. estimate () and your training history to provide a target race time. The watch analyzes several weeks of your training data to refine the race time estimates.
TIP: If you have more than one Garmin device, you can specify your primary training device in the Garmin Connect app, which allows your watch to sync activities, history, and data from other devices ().
- From the watch face, press UP or DOWN to view the performance glance.
- Press START to view glance details.
- Press UP or DOWN to view a predicted race time.
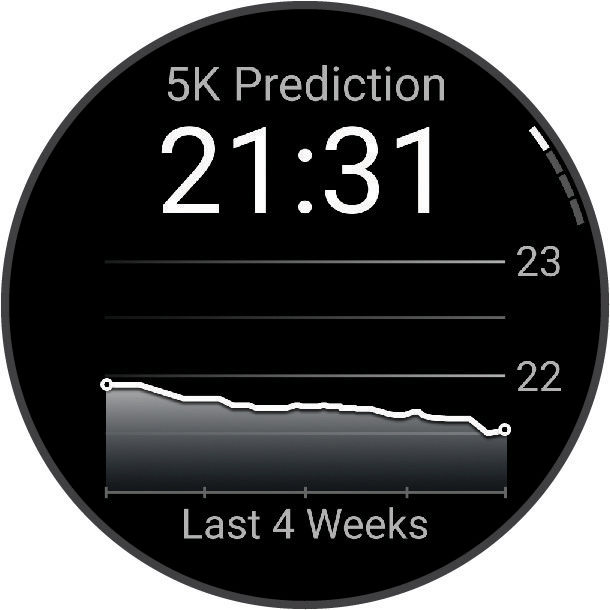
- Press START to view predictions for other distances.
NOTE: The predictions may seem inaccurate at first. The watch requires a few runs to learn about your running performance.
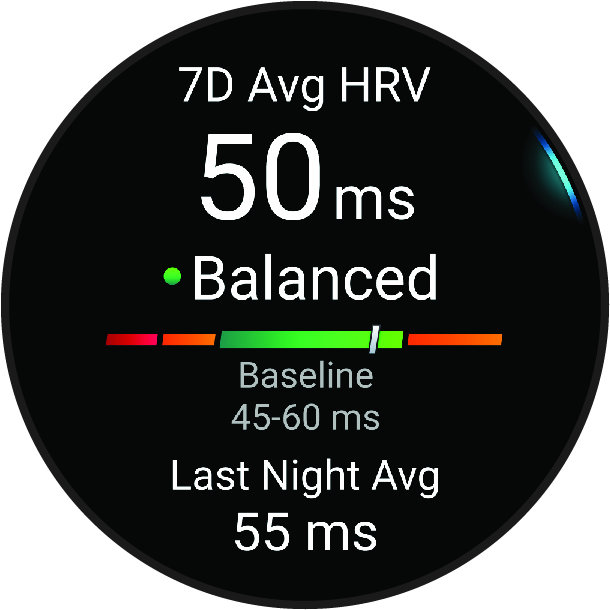
Your watch analyzes your wrist heart rate readings while you are sleeping to determine your heart rate variability (HRV). Training, physical activity, sleep, nutrition, and healthy habits all impact your heart rate variability. HRV values can vary widely based on gender, age, and fitness level. A balanced HRV status may indicate positive signs of health such as good training and recovery balance, greater cardiovascular fitness, and resilience to stress. An unbalanced or poor status may be a sign of fatigue, greater recovery needs, or increased stress. For best results, you should wear the watch while sleeping. The watch requires three weeks of consistent sleep data to display your heart rate variability status.
|
Color Zone |
Status |
Description |
|
|
|
Green |
Balanced |
Your seven-day average HRV is within your baseline range. |
|
|
Orange |
Unbalanced |
Your seven-day average HRV is above or below your baseline range. |
|
|
Red |
Low |
Your seven-day average HRV is well below your baseline range. |
|
No color |
Poor |
Your HRV values are averaging well below the normal range for your age. |
|


You can sync your watch with your Garmin Connect account to view your current heart rate variability status, trends, and educational feedback.
As you complete your activity, such as running or cycling, the performance condition feature analyzes your pace, heart rate, and heart rate variability to make a real-time assessment of your ability to perform compared to your average fitness level. It is approximately your real-time percentage deviation from your baseline VO2 max. estimate.
Performance condition values range from -20 to +20. After the first 6 to 20 minutes of your activity, the device displays your performance condition score. For example, a score of +5 means that you are rested, fresh, and capable of a good run or ride. You can add performance condition as a data field to one of your training screens to monitor your ability throughout the activity. Performance condition can also be an indicator of fatigue level, especially at the end of a long training run or ride.
NOTE: The device requires a few runs or rides with a heart rate monitor to get an accurate VO2 max. estimate and learn about your running or riding ability ().
Viewing Your Performance Condition
This feature requires wrist-based heart rate or a compatible chest heart rate monitor.
- Add Performance Condition to a data screen ().
- Go for a run or ride.
After 6 to 20 minutes, your performance condition appears.
- Scroll to the data screen to view your performance condition throughout the run or ride.
Lactate threshold is the exercise intensity at which lactate (lactic acid) starts to accumulate in the bloodstream. In running, this intensity level is estimated in terms of pace, heart rate, or power. When a runner exceeds the threshold, fatigue starts to increase at an accelerating rate. For experienced runners, the threshold occurs at approximately 90% of their maximum heart rate and between 10 km and half-marathon race pace. For average runners, the lactate threshold often occurs well below 90% of maximum heart rate. Knowing your lactate threshold can help you determine how hard to train or when to push yourself during a race.
If you already know your lactate threshold heart rate value, you can enter it in your user profile settings (). You can turn on the Auto Detection feature to automatically record your lactate threshold during an activity.
Performing a Guided Test to Determine Your Lactate Threshold
This feature requires a Garmin chest heart rate monitor. Before you can perform the guided test, you must put on a heart rate monitor and pair it with your device ().
The device uses your user profile information from the initial setup and your VO2 max. estimate to estimate your lactate threshold. The device will automatically detect your lactate threshold during runs at a steady, high intensity with heart rate.
TIP: The device requires a few runs with a chest heart rate monitor to get an accurate maximum heart rate value and VO2 max. estimate. If you are having trouble getting a lactate threshold estimate, try manually lowering your maximum heart rate value.
- From the watch face, select START.
- Select an outdoor running activity.
GPS is required to complete the test.
- Hold UP.
- Select Training > Lactate Threshold Guided Test.
- Start the timer, and follow the on-screen instructions.
After you begin your run, the device displays each step duration, the target, and current heart rate data. A message appears when the test is complete.
- After you complete the guided test, stop the timer and save the activity.
If this is your first lactate threshold estimate, the device prompts you to update your heart rate zones based on your lactate threshold heart rate. For each additional lactate threshold estimate, the device prompts you to accept or decline the estimate.
Before you can view your power curve, you must record a ride that’s at least one hour long using a power meter in the last 90 days ().
You can create workouts in your Garmin Connect account. The power curve displays your sustained power output over time. You can view your power curve for the previous month, three months, or twelve months.
From the Garmin Connect app menu, select Performance Stats > Power Curve.
Syncing Activities and Performance Measurements
You can sync activities and performance measurements from other Garmin devices to your Forerunner watch using your Garmin Connect account. This allows your watch to more accurately reflect your training status and fitness. For example, you can record a ride with an Edge bike computer, and view your activity details and overall training load on your Forerunner watch.
Sync your Forerunner watch and other Garmin devices to your Garmin Connect account.
TIP: You can set a primary training device and primary wearable in the Garmin Connect app ().
Recent activities and performance measurements from your other Garmin devices appear on your Forerunner watch.
Turning Off Performance Notifications
Some performance notifications appear upon completion of your activity. Some performance notifications appear during an activity or when you achieve a new performance measurement, such as a new VO2 max. estimate. You can turn off the performance condition feature to avoid some of these notifications.
- Hold UP.
- Select System > Performance Condition.