Running Dynamics Data and Gauges
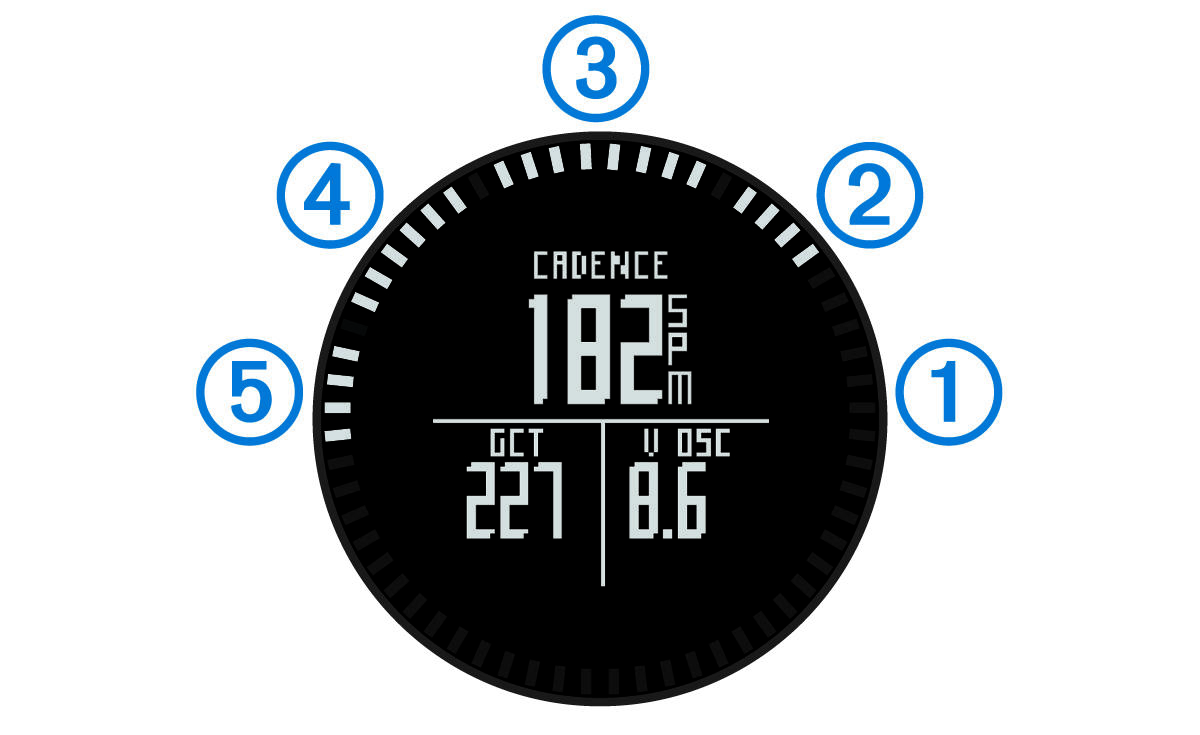
The running dynamics screen displays a gauge for a primary metric. You can display cadence, vertical oscillation, or ground contact time as the primary metric. The gauge shows you how your running dynamics data compares to those of other runners. The zones are based on percentiles.
Garmin® has gathered data on runners with different levels of experience. The data values in zones four and five are typical for less experienced or slower runners. The data values in zones one, two, and three are typical for more experienced or faster runners. Less experienced runners tend to exhibit longer ground contact times, higher vertical oscillation, and lower cadence than more experienced runners. However, taller runners typically have slightly slower cadences and slightly higher vertical oscillation. Go to www.garmin.com for more information on running dynamics. For additional theories and interpretations of running dynamics data, you can search reputable running publications and websites.
|
Zone |
Percentile in Zone |
Cadence Range |
Vertical Oscillation Range |
Ground Contact Time Range |
|---|---|---|---|---|
|
|
>95 |
>185 spm |
<6.7 cm |
<208 ms |
|
|
70–95 |
174–185 spm |
6.7–8.3 cm |
208–240 ms |
|
|
30–69 |
163–173 spm |
8.4–10.0 cm |
241–272 ms |
|
|
5–29 |
151–162 spm |
10.1–11.8 cm |
273–305 ms |
|
|
<5 |
<151 spm |
>11.8 cm |
>305 ms |


