Running Dynamics
Running dynamics is real-time feedback about your running form. Your Forerunner® watch has an accelerometer to calculate five running form metrics. To view all of the running form metrics, you must pair your Forerunner watch with the HRM 600, HRM-Fit™, HRM-Pro™ series accessory, or other running dynamics accessory that measures torso movement. For more information, go to www.garmin.com/performance-data/running/.
|
Metric |
Sensor Type |
Description |
|---|---|---|
|
Cadence |
Watch or compatible accessory |
Cadence is the number of steps per minute. It displays the total steps (right and left combined). |
|
Stride length |
Watch or compatible accessory |
Stride length is the length of your stride from one footfall to the next. It is measured in meters. |
|
Vertical oscillation |
Watch or compatible accessory |
Vertical oscillation is your bounce while running. It displays the vertical motion of your torso, measured in centimeters. |
|
Vertical ratio |
Watch or compatible accessory |
Vertical ratio is the ratio of vertical oscillation to stride length. It displays a percentage. A lower number typically indicates better running form. |
|
Ground contact time |
Watch or compatible accessory |
Ground contact time is the amount of time in each step that you spend on the ground while running. It is measured in milliseconds.
NOTE:
Ground contact metrics are not available while walking.
|
|
Ground contact time balance |
Compatible accessory only |
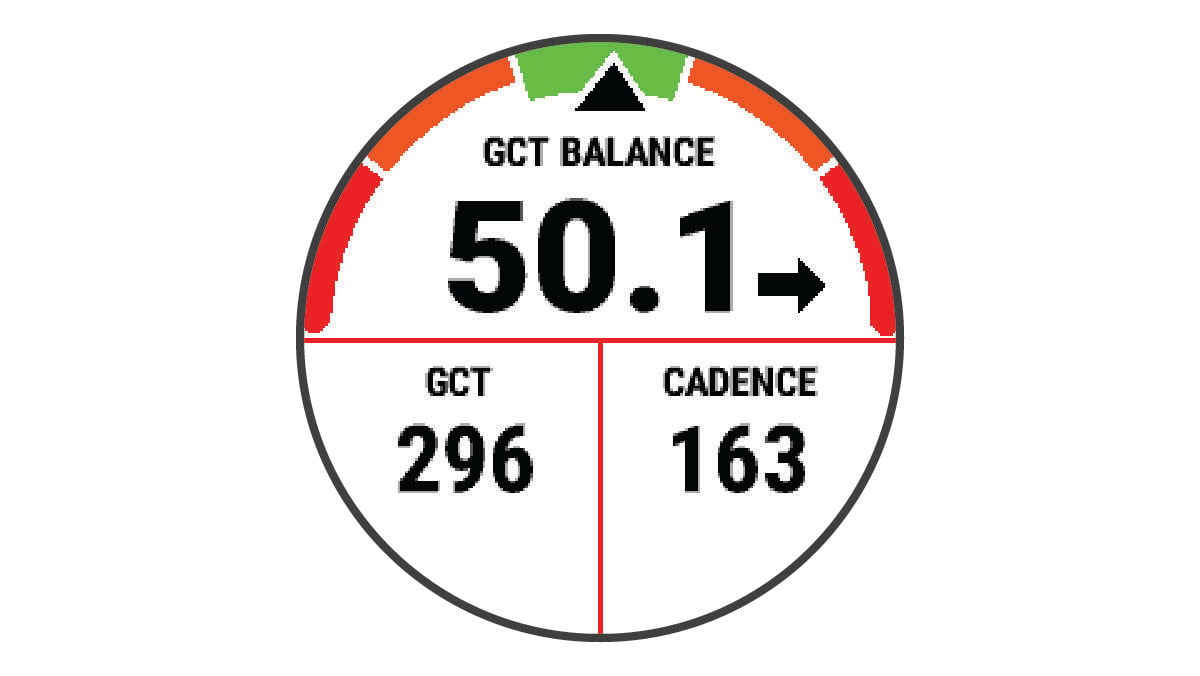
Ground contact time balance displays the left/right balance of your ground contact time while running. It displays a percentage. For example, 53.2 with an arrow pointing left or right. |
Training with Running Dynamics
The watch automatically uses wrist-based running dynamics unless you pair a compatible running dynamics accessory (Pairing Your Wireless Sensors). You can add a running dynamics screen to any running activity (Customizing the Data Screens).
-
Scroll to the running dynamics screen to view your metrics.
Remember: Ground contact time balance is available only if you are using a compatible running dynamics accessory. -
If necessary, hold
 to edit how the running dynamics data appears.
Color Gauges and Running Dynamics Data
The running dynamics screens display a color gauge for the primary metric. You can display cadence, vertical oscillation, ground contact time, ground contact time balance, or vertical ratio as the primary metric. The color gauge shows you how your running dynamics data compare to those of other runners. The color zones are based on percentiles.
Garmin® has researched many runners of all different levels. The data values in the red or orange zones are typical for less experienced or slower runners. The data values in the green, blue, or purple zones are typical for more experienced or faster runners. More experienced runners tend to exhibit shorter ground contact times, lower vertical oscillation, lower vertical ratio, and higher cadence than less experienced runners. However, taller runners typically have slightly slower cadences, longer strides, and slightly higher vertical oscillation. Vertical ratio is your vertical oscillation divided by stride length. It is not correlated with height.
Go to www.garmin.com/performance-data/running/ for more information on running dynamics. For additional theories and interpretations of running dynamics data, you can search reputable running publications and websites.
|
Color Zone |
Percentile in Zone |
Cadence Range |
Ground Contact Time Range |
|---|---|---|---|
|
|
>95 |
>183 spm |
<218 ms |
|
|
70–95 |
174–183 spm |
218–248 ms |
|
|
30–69 |
164–173 spm |
249–277 ms |
|
|
5–29 |
153–163 spm |
278–308 ms |
|
|
<5 |
<153 spm |
>308 ms |
 Purple
 Blue
Blue
 Green
Green
 Orange
 Red
Red
Ground Contact Time Balance Data
Ground contact time balance measures your running symmetry and appears as a percentage of your total ground contact time. For example, 51.3% with an arrow pointing left indicates the runner is spending more time on the ground when on the left foot. If your data screen displays both numbers, for example 48–52, 48% is the left foot and 52% is the right foot.
|
Color Zone |
|
|
|
|
|
|---|---|---|---|---|---|
|
Symmetry |
Poor |
Fair |
Good |
Fair |
Poor |
|
Percent of Other Runners |
5% |
25% |
40% |
25% |
5% |
|
Ground Contact Time Balance |
>52.2% L |
50.8–52.2% L |
50.7% L–50.7% R |
50.8–52.2% R |
>52.2% R |
While developing and testing running dynamics, the Garmin team found correlations between injuries and greater imbalances with certain runners. For many runners, ground contact time balance tends to deviate further from 50–50 when running up or down hills. Most running coaches agree that a symmetrical running form is good. Elite runners tend to have quick and balanced strides.
You can watch the gauge or data field during your run or view the summary on your Garmin Connect™ account after your run. As with the other running dynamics data, ground contact time balance is a quantitative measurement to help you learn about your running form.
Vertical Oscillation and Vertical Ratio Data
The data ranges for vertical oscillation and vertical ratio are slightly different depending on the sensor and whether it is positioned at the chest (HRM 600, HRM-Fit, or HRM-Pro series accessories) or at the waist (Running Dynamics Pod accessory).
|
Color Zone |
Percentile in Zone |
Vertical Oscillation Range at Chest |
Vertical Oscillation Range at Waist |
Vertical Ratio at Chest |
Vertical Ratio at Waist |
|---|---|---|---|---|---|
|
|
>95 |
<6.4 cm |
<6.8 cm |
<6.1% |
<6.5% |
|
|
70–95 |
6.4–8.1 cm |
6.8–8.9 cm |
6.1–7.4% |
6.5–8.3% |
|
|
30–69 |
8.2–9.7 cm |
9.0–10.9 cm |
7.5–8.6% |
8.4–10.0% |
|
|
5–29 |
9.8–11.5 cm |
11.0–13.0 cm |
8.7–10.1% |
10.1–11.9% |
|
|
<5 |
>11.5 cm |
>13.0 cm |
>10.1% |
>11.9% |
Tips for Missing Running Dynamics Data
This topic provides tips for using a compatible running dynamics accessory. If the accessory is not connected to your watch, the watch automatically switches to wrist-based running dynamics.